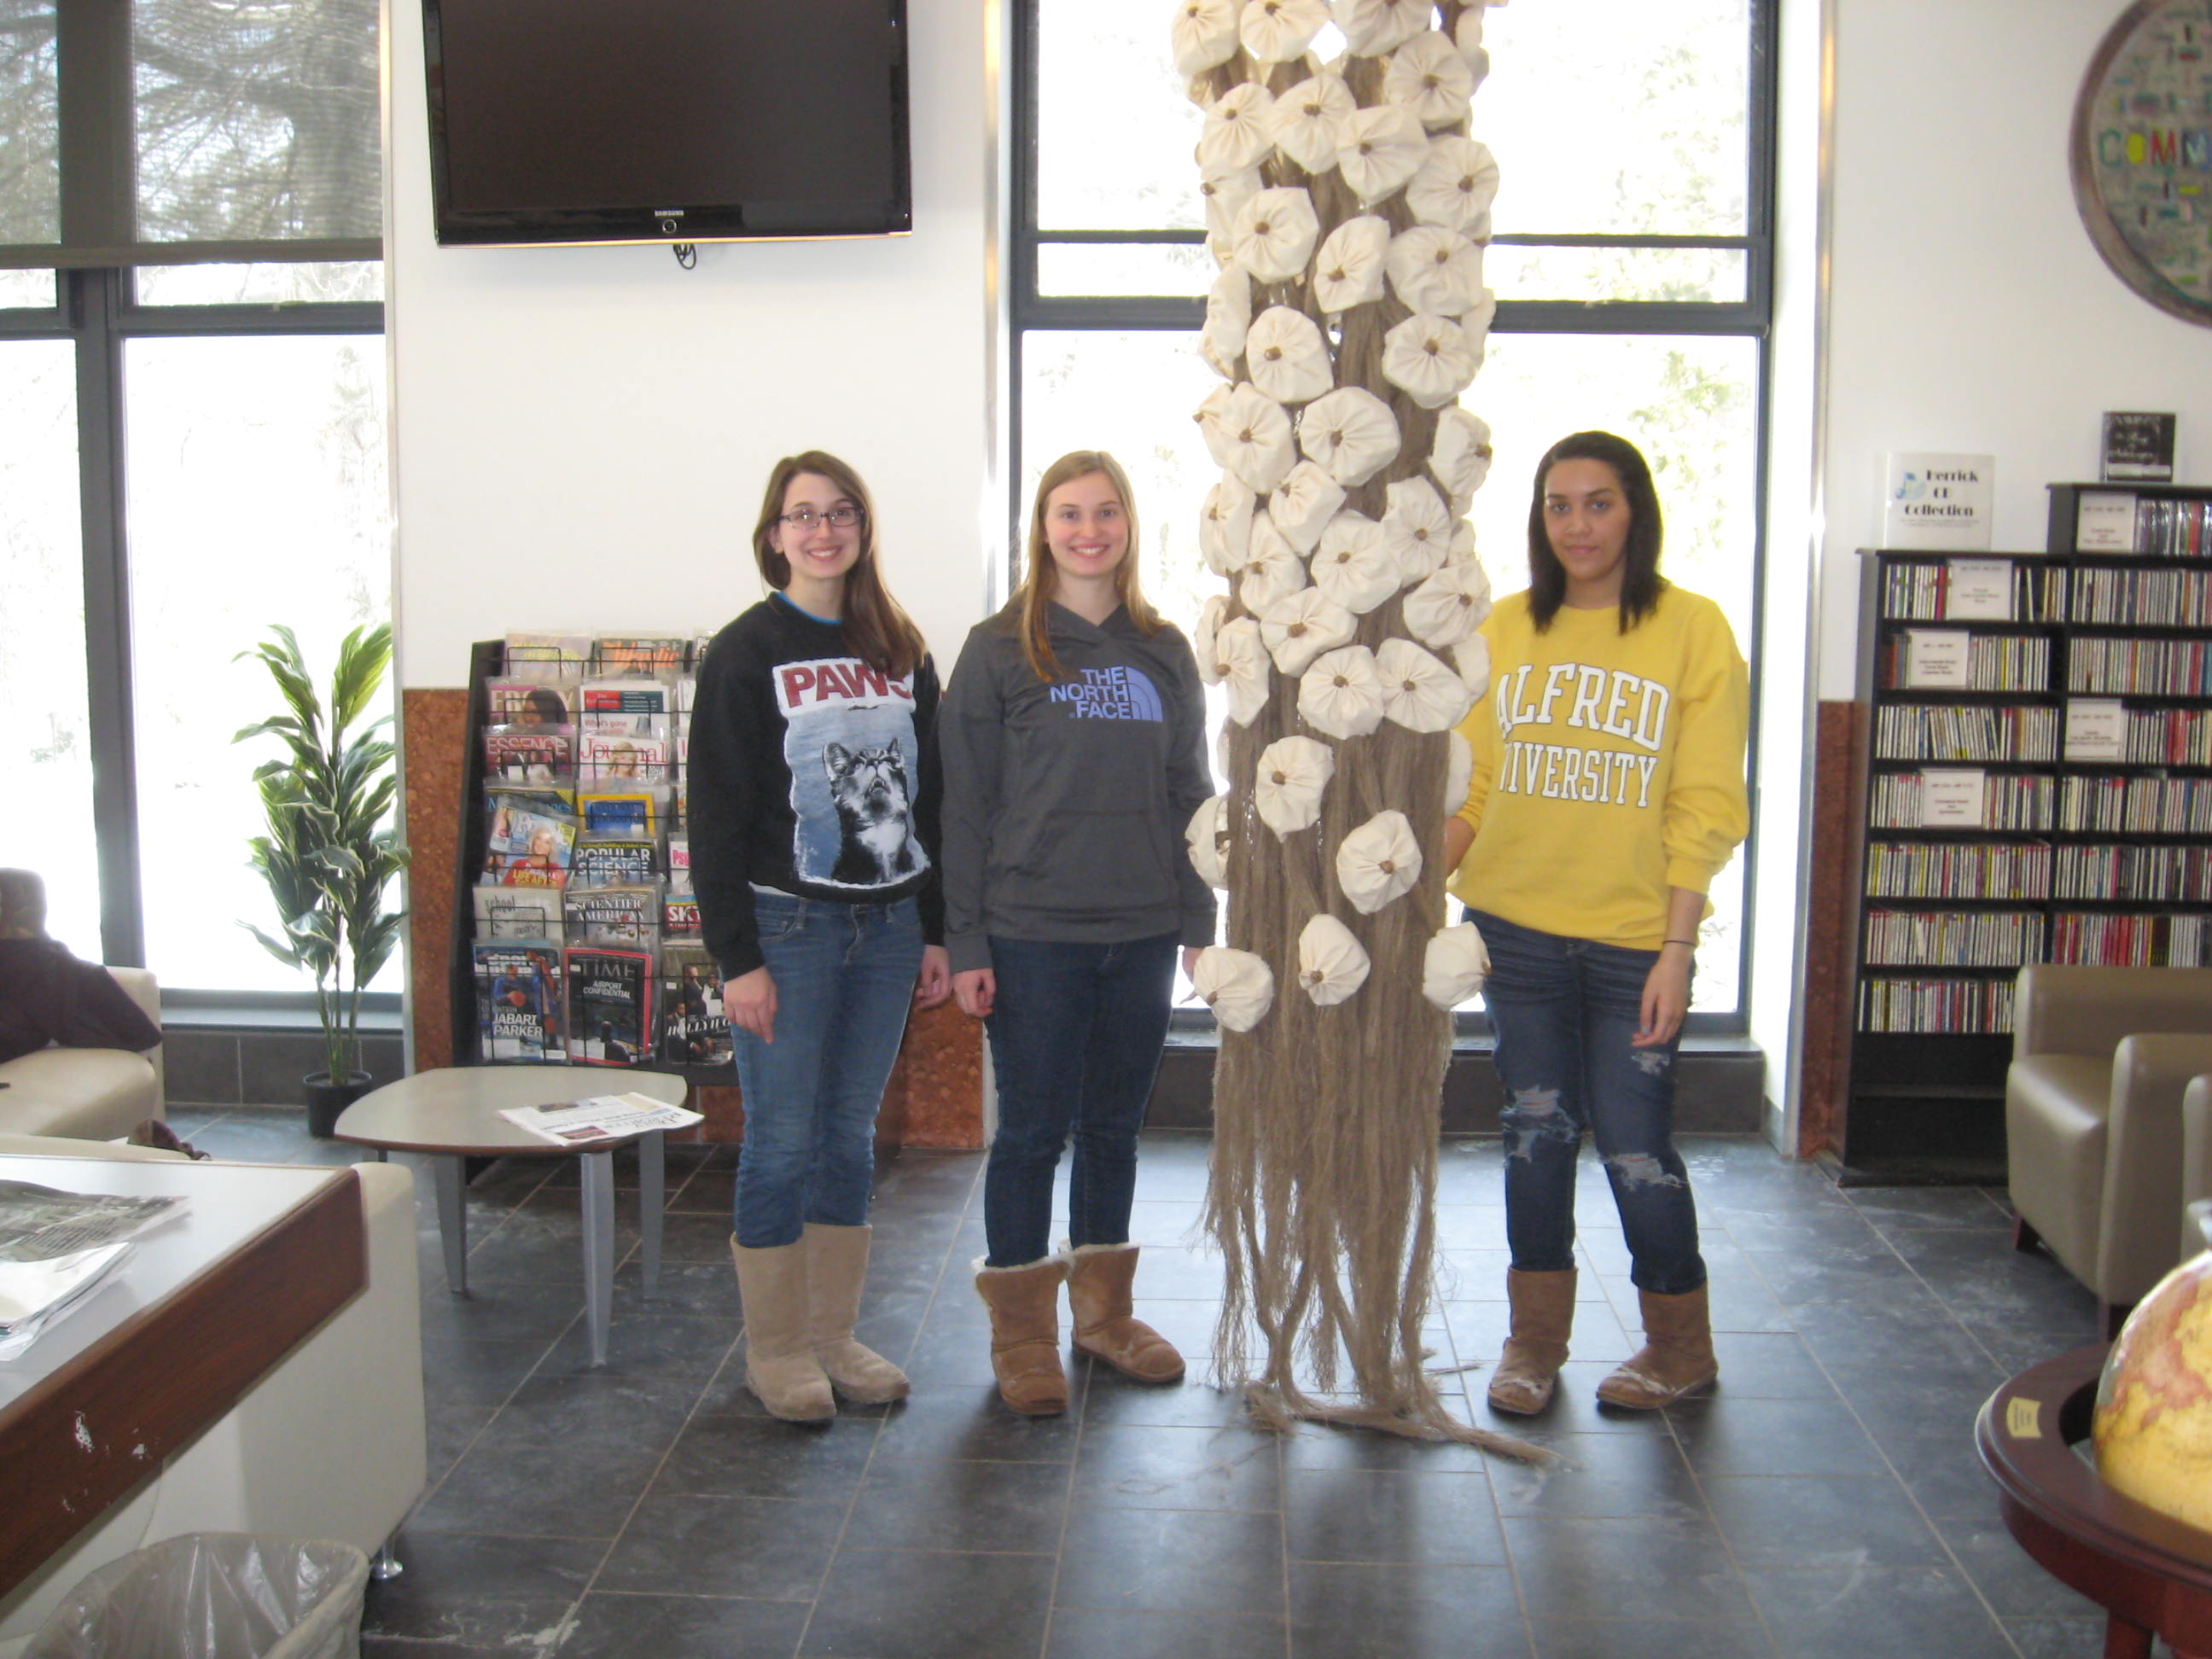
Liz Dangelantonio, Laura Christian and Meg Cardwell stand with their untitled fiber sculpture on March 4th in the Book End Lounge. The piece was created for their IArt class with professor Laurel Carpenter.
The installation will be available for viewing in the lounge until 5:30 p.m. on Wednesday, March 5th.
Category Archives: Uncategorized
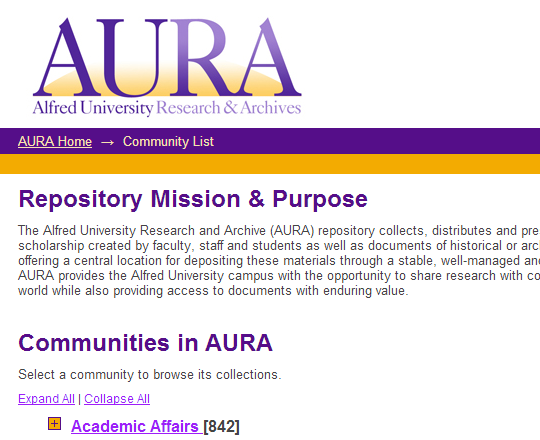
AURA — Alfred University Research and Archive
![]()
What is AURA? No, not aura, a distinctive atmosphere, or an energy field from a living being, but AURA. AURA stands for the Alfred University Research and Archive. It’s Alfred University’s own digital repository, a place to discover the past and inform the future.
What is a digital repository?
- A means of storing and providing access to digital content (research, scholarship and documents of historical significance)
- Provides a stable, well-managed, permanent archive for digital scholarly and research materials of enduring value produced by faculty, staff, and students
- Supports research, learning and administrative processes
- Includes a wide range of content: research data, meeting minutes, newsletters, theses and dissertations, published articles, technical reports, conference papers, historical information, etc.
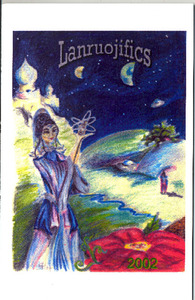
For example, this newletter of the Science Fiction Club, Lanruojifics, Fall 2002
What are the benefits of a digital repository?
- Content can be searched full-text, across all documents
- Allows the content to be shared locally and globally
- Allows wide and rapid dissemination of intellectual output, thereby raising awareness of Alfred University to a wider audience
- Stores and organizes the plethora of digital documents created on campus in one place, accessible from anywhere
- Supports a wide range of file types (text, images, video, data sets, etc.)
- Access to content can be restricted as needed
- Required for researchers applying for certain types of federal funding
- Usage can be tracked for statistical purposes
Why not just put this material into Blackboard?
- AURA makes content available to external audiences (open access availability)
- AURA’s content can be indexed by search engine harvesters (such as Google)
- AURA’s content is organized into collections and subcollections
- BlackBoard was designed as a course management system; not a document warehouse. It doesn’t allow for searching across documents and doesn’t manage collections or access to them as well as AURA does.
How can you help to build AURA?
- · Submit your club’s publications and meeting minutes for inclusion in AURA
- · Submit your publications and research to AURA.
- · Submit publications from your program, division, school and college. Help us keep AU’s institutional memory strong in the digital era.
Want to check out AURA right now?
http://aura.alfred.edu
— Steve Crandall
Former student library employees pay it forward
Anyone who visits the Alfred University libraries is sure to notice the helpful students working at our front desks. You might be surprised to learn, though, that the Alfred University libraries employ nearly 100 students in a typical semester. That’s a lot of students!
I contacted some former student employees to ask how the experience of working in the libraries impacted their job searches and career plans after graduation. As the following examples illustrate, students gain highly marketable skills while working in the libraries and the experience can have a strong influence on their eventual career plans.

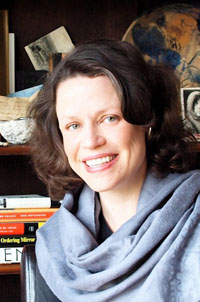
Catherine Dillon
Working at Herrick Library had a big impact on Catherine Dillon’s career aspirations after graduation. She says, “I have a great amount of respect for my supervisors at Herrick Library and they were key figures in guiding my career focus.” After graduation, Catherine became an evening and weekend supervisor at Binghamton University’s Bartle Library, and was later promoted to Library Reader Services Coordinator. She is working towards a Master of Library and Information Services degree at the University of Buffalo. She credits her time at Herrick with helping her to “learn to approach work with an open and flexible mindset, which in this job market is key.”
For Kristin Eklin, working as a student supervisor at Herrick Library made her realize that she wanted to eventually work in a leadership or management position. Working with student supervisees and patrons gave her a chance to sharpen her communication skills and helped prepare her for her current position in event planning and marketing at St. John’s Foundation in Rochester. Kristin says that her experience at Herrick was “extremely valuable during job interviews. Many employers prefer job candidates that have maintained steady employment through out college and demonstrated growth in to the role of supervisor. This position also displayed my ability to work with peers, faculty, and staff.”

Olivia “Liv” Tsistinas
After graduating from Alfred with a BFA, Olivia “Liv” Tsistinas wasn’t sure what she would do next. Her experience at Herrick Library helped her to land a job as an evening and weekend supervisor in a library. She went on to earn a Master of Library Science degree and is now a Clinical/Outreach Librarian at Upstate Medical University’s Health Science Library. While it may seem a long way from art school, Liv says that she has found ways to use her background in art, including coordinating library exhibitions in two gallery spaces. She says, “I love being able to incorporate all the facets of my Alfred University experience into what I do!”
Caitlin Brown, who works as a monograph cataloger at the Indiana University law library, says that she “liked working in the library so much that I got an MLS and became a librarian!” At the Scholes circulation desk, where she worked from 2006 to 2008, she found herself “kind of in the middle of everything” and used the experience to improve her research skills. In grad school, where positions were very competitive, she found that her experience at Scholes was a definite plus.
Oceana Wilson
Working at Herrick Library was the first step in a career in libraries for Oceana Wilson, eventually leading to her current position as Director of Library and Information Services at Bennington College. While at Herrick, she had the opportunity “to see some of the behind the scenes work that went into creating the innovative services and responsive environment of Herrick Library. “ It was getting to know the librarians at Herrick that encouraged her to become a librarian. She says, “They really believed in the work that they were doing and that was very inspiring.”
When Jessie Baldwin sought work at Scholes Library, she already knew that she wanted to be a librarian. She gained lots of practical experience at Scholes, from working at the circulation desk, to helping students to find books, and being responsible for opening the library.
Jessie Baldwin
The experience helped her to get into a library science graduate program and, while she was still in school, to be hired at the Upstate Medical Library. She says, “I learned a ton that I still carry with me. I always felt I had one of the best work study jobs at Alfred.”
At Herrick Library, Greg Arnold gained skills in customer service and staff supervision, both of which helped him to land his current position as Lead Library Assistant at the Werner Medical Library in Rochester. He says that he wouldn’t have known where to start if he hadn’t “supervised student workers, handled patron questions and complaints, interacted and communicated with my supervisors, and dealt with the occasional craziness that comes with libraries.” Greg’s experience at Herrick gave him a greater appreciation for what libraries do and helped to clarify his career goals, which includes a desire to own his own business one day.
Joy Thomas with her husband
After graduating from Alfred University, Joy Thomas worked briefly in retail before taking a position at the Cornell University Library, first in access services and, for the last six years, as Borrowing Coordinator for Interlibrary Loan. She says that it was her experience working in access services at Herrick Library helped her to get her first library position. She “really loves working in the library and can’t see that ending anytime soon.”
These are just some examples of ways in which students have benefited from the experience of working in the Alfred University libraries. Of course, the libraries benefit as well! Without student employees, the libraries couldn’t function at anywhere near their current levels of service – students open and close the libraries, and provide essential services in the evenings and on weekends when full-time staff and librarians have gone home. Students bring other benefits to the libraries, too. As Herrick librarian Brian Sullivan notes, “Student workers keep the library’s culture, perspective, and values centered on our primary patrons, AU students!”
— Ellen Bahr
“1st International Photographic Button Show, or Revisiting the Button Button Show”
With all of the photo based shows opening up this week around campus, I was inspired to re-visit a display I organized for Scholes library four years ago, the “1st International Photographic Button Show, or Revisiting the Button Button Show.” 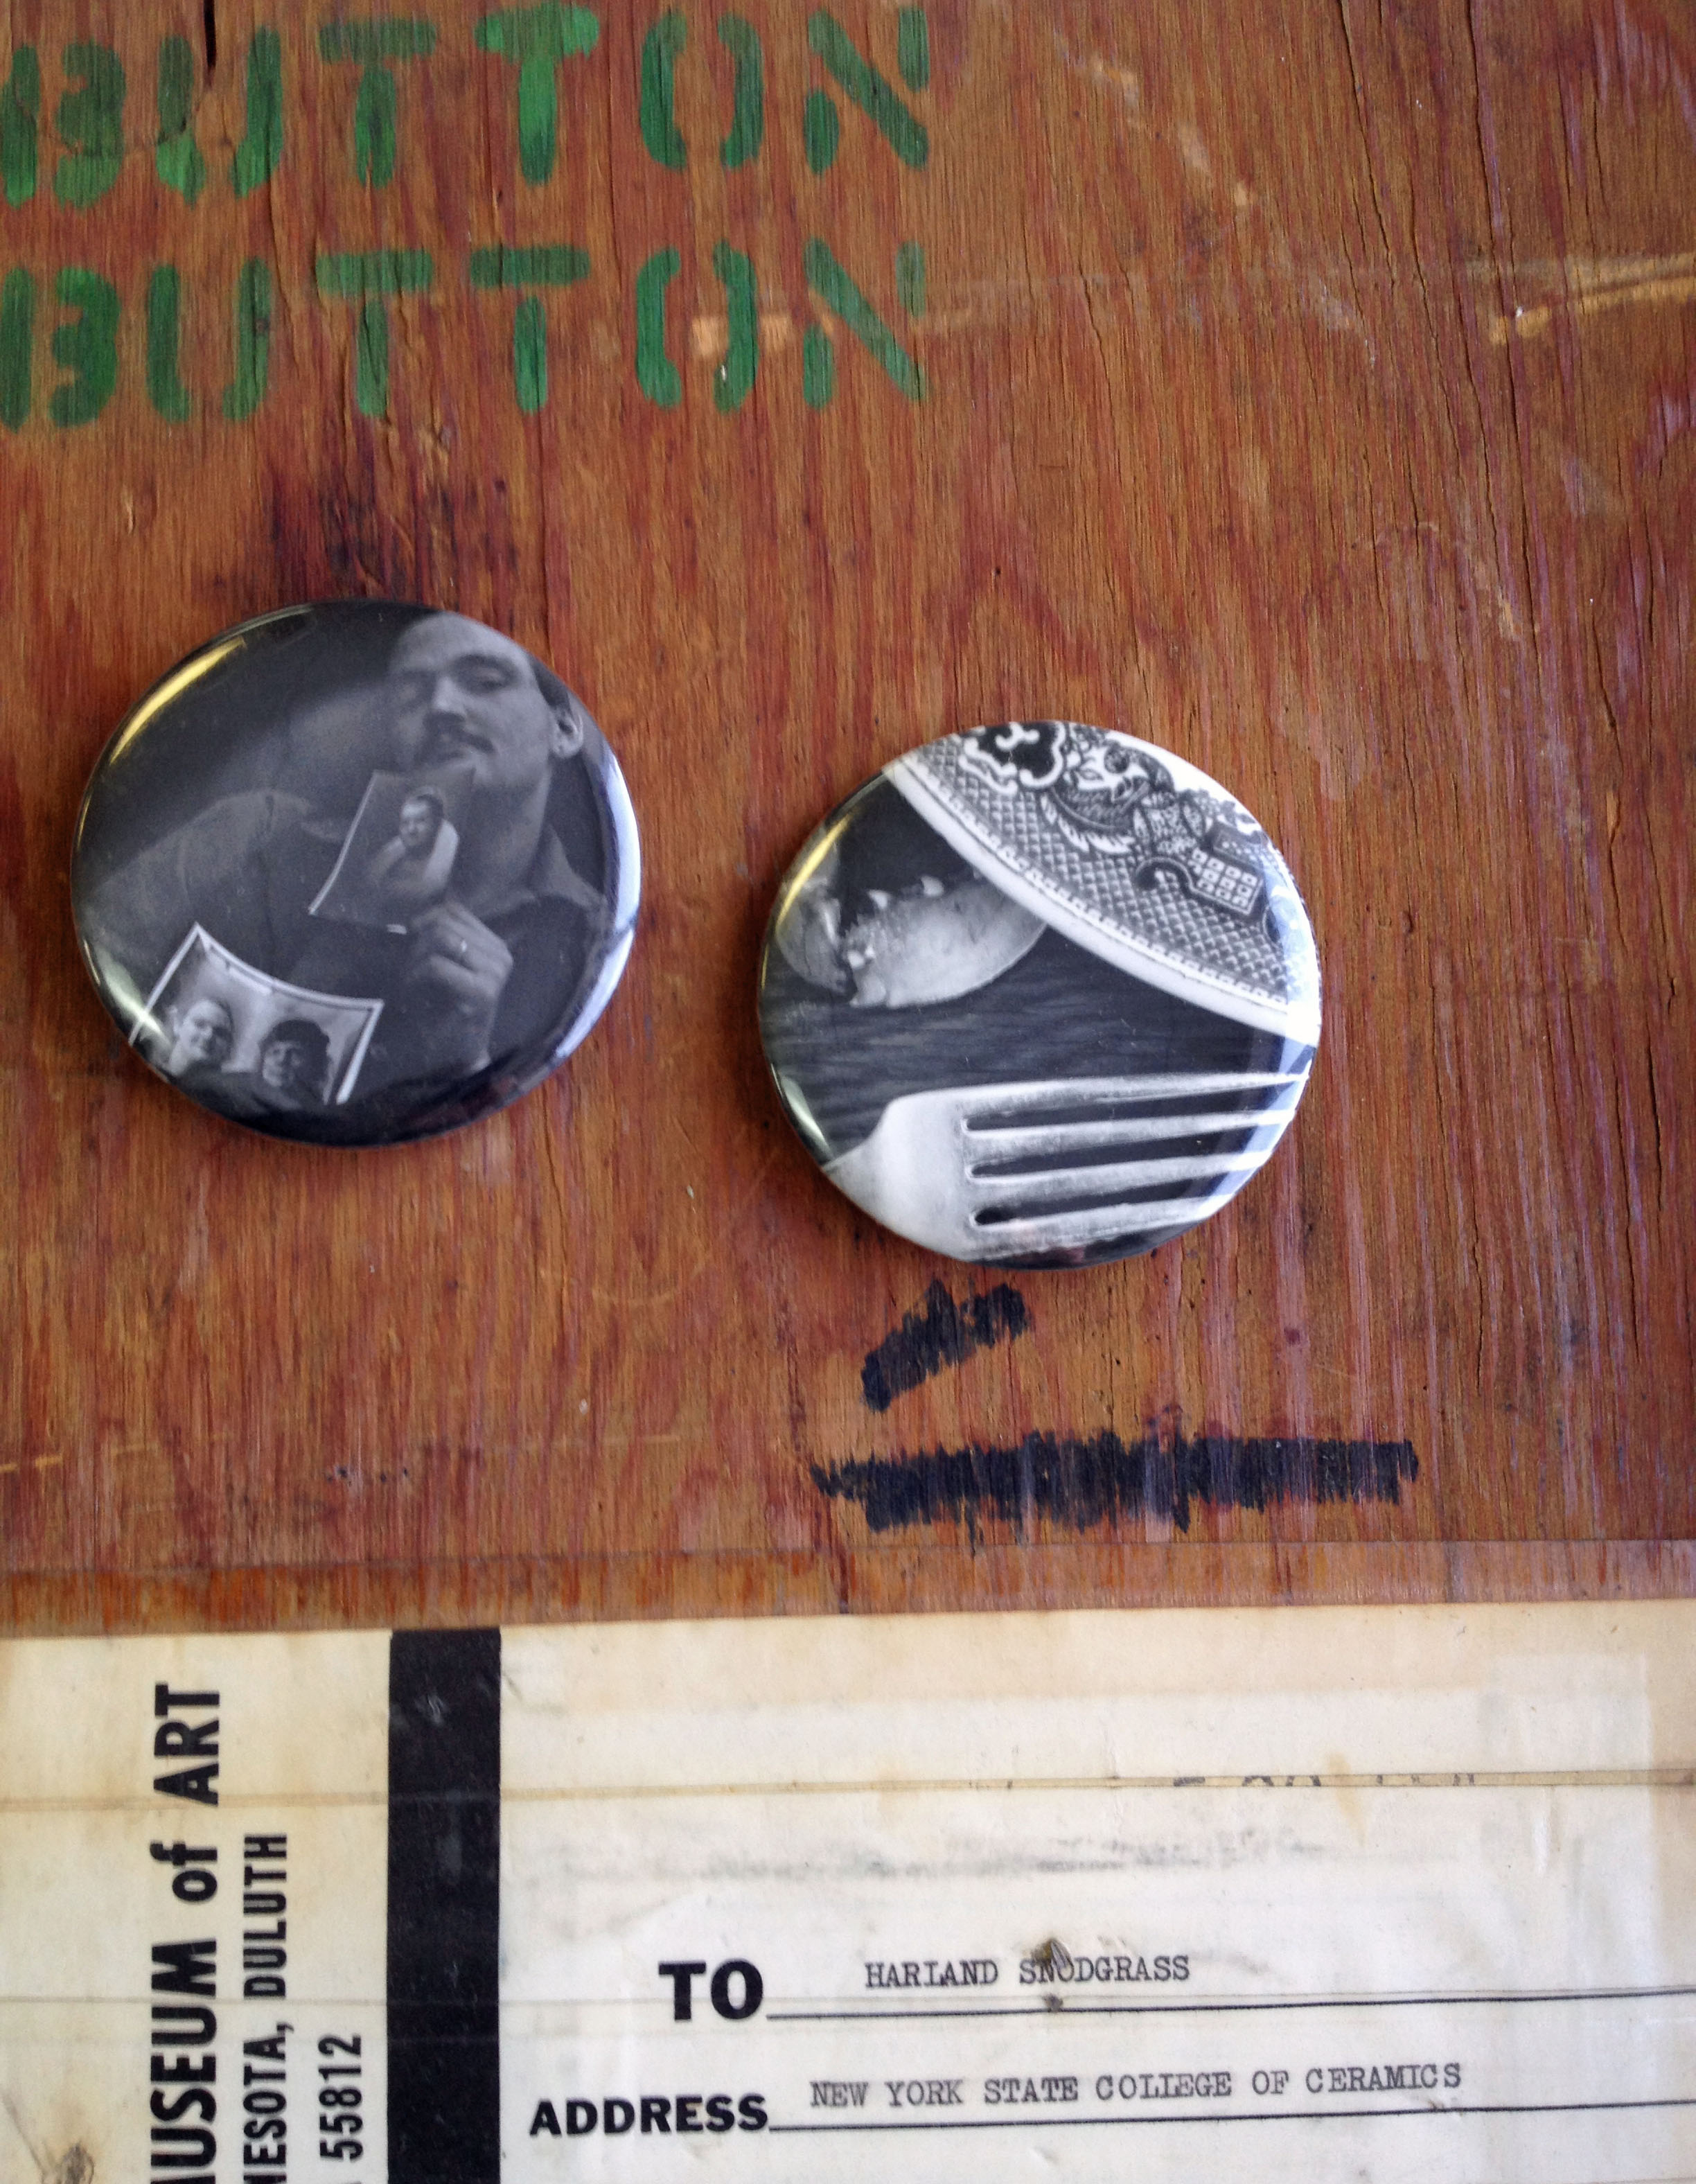 Harland Snodgrass, professor of painting and video at the College of Ceramics from 1969 to 1985, donated the buttons to Scholes Library back in 2008, along with a series of videotapes he made as a faculty member here.
The “Button Button” show originated in 1976 when Harland sent out over 2000 requests for submittals. Each artist who submitted work was asked to submit four identical images, one of which was returned as a button to the artist while the other three were added to the traveling exhibitions. Submissions came in from all over the United States, as well as Canada, Uruguay, Scotland, and England and, in the end, he received a total of 200 entries. Each entry was die cut by Harland and made in to a button. The show traveled “from coast to coast,” being exhibited in galleries and museums.
In 2010, Harland sent me an email describing the show, which was first installed in Fosdick Nelson Gallery in March 1977. At the end of the description he explains how one of the buttons contained a hidden video camera and the images of gallery visitors were projected live through a monitor at the front of Fosdick Nelson Gallery.
“The show was a dotted line – buttons spaced eye height – about 8″apart, all around the entire gallery with late submissions piled up at the entry.  As crowd came in, they cued up and made this slow, shuffling line, following the dots around the entire space. Was wild because of the button’s size, everyone was sucked right up to the walls and the entire center was empty. I made a show poster in the window foam board of the entrance saying BUTTON BUTTON with a 12 ” hole cut out with a video monitor pushed up to it from behind. Looked like one of the buttons except it moved.
I had a very wide lens on a b/w camera and as folks came by the semi hidden camera, while looking closely at the buttons, they became a distorted, graphic part of the advertisement outside the gallery. Moving button images . . .”
— Snodgrass, Harland. E-mail to John Hosford, August 30, 2010
In the short time I have known him, Harland has always exhibited a keen sense of community with Alfred and, more specifically, with the School of Art and Design. 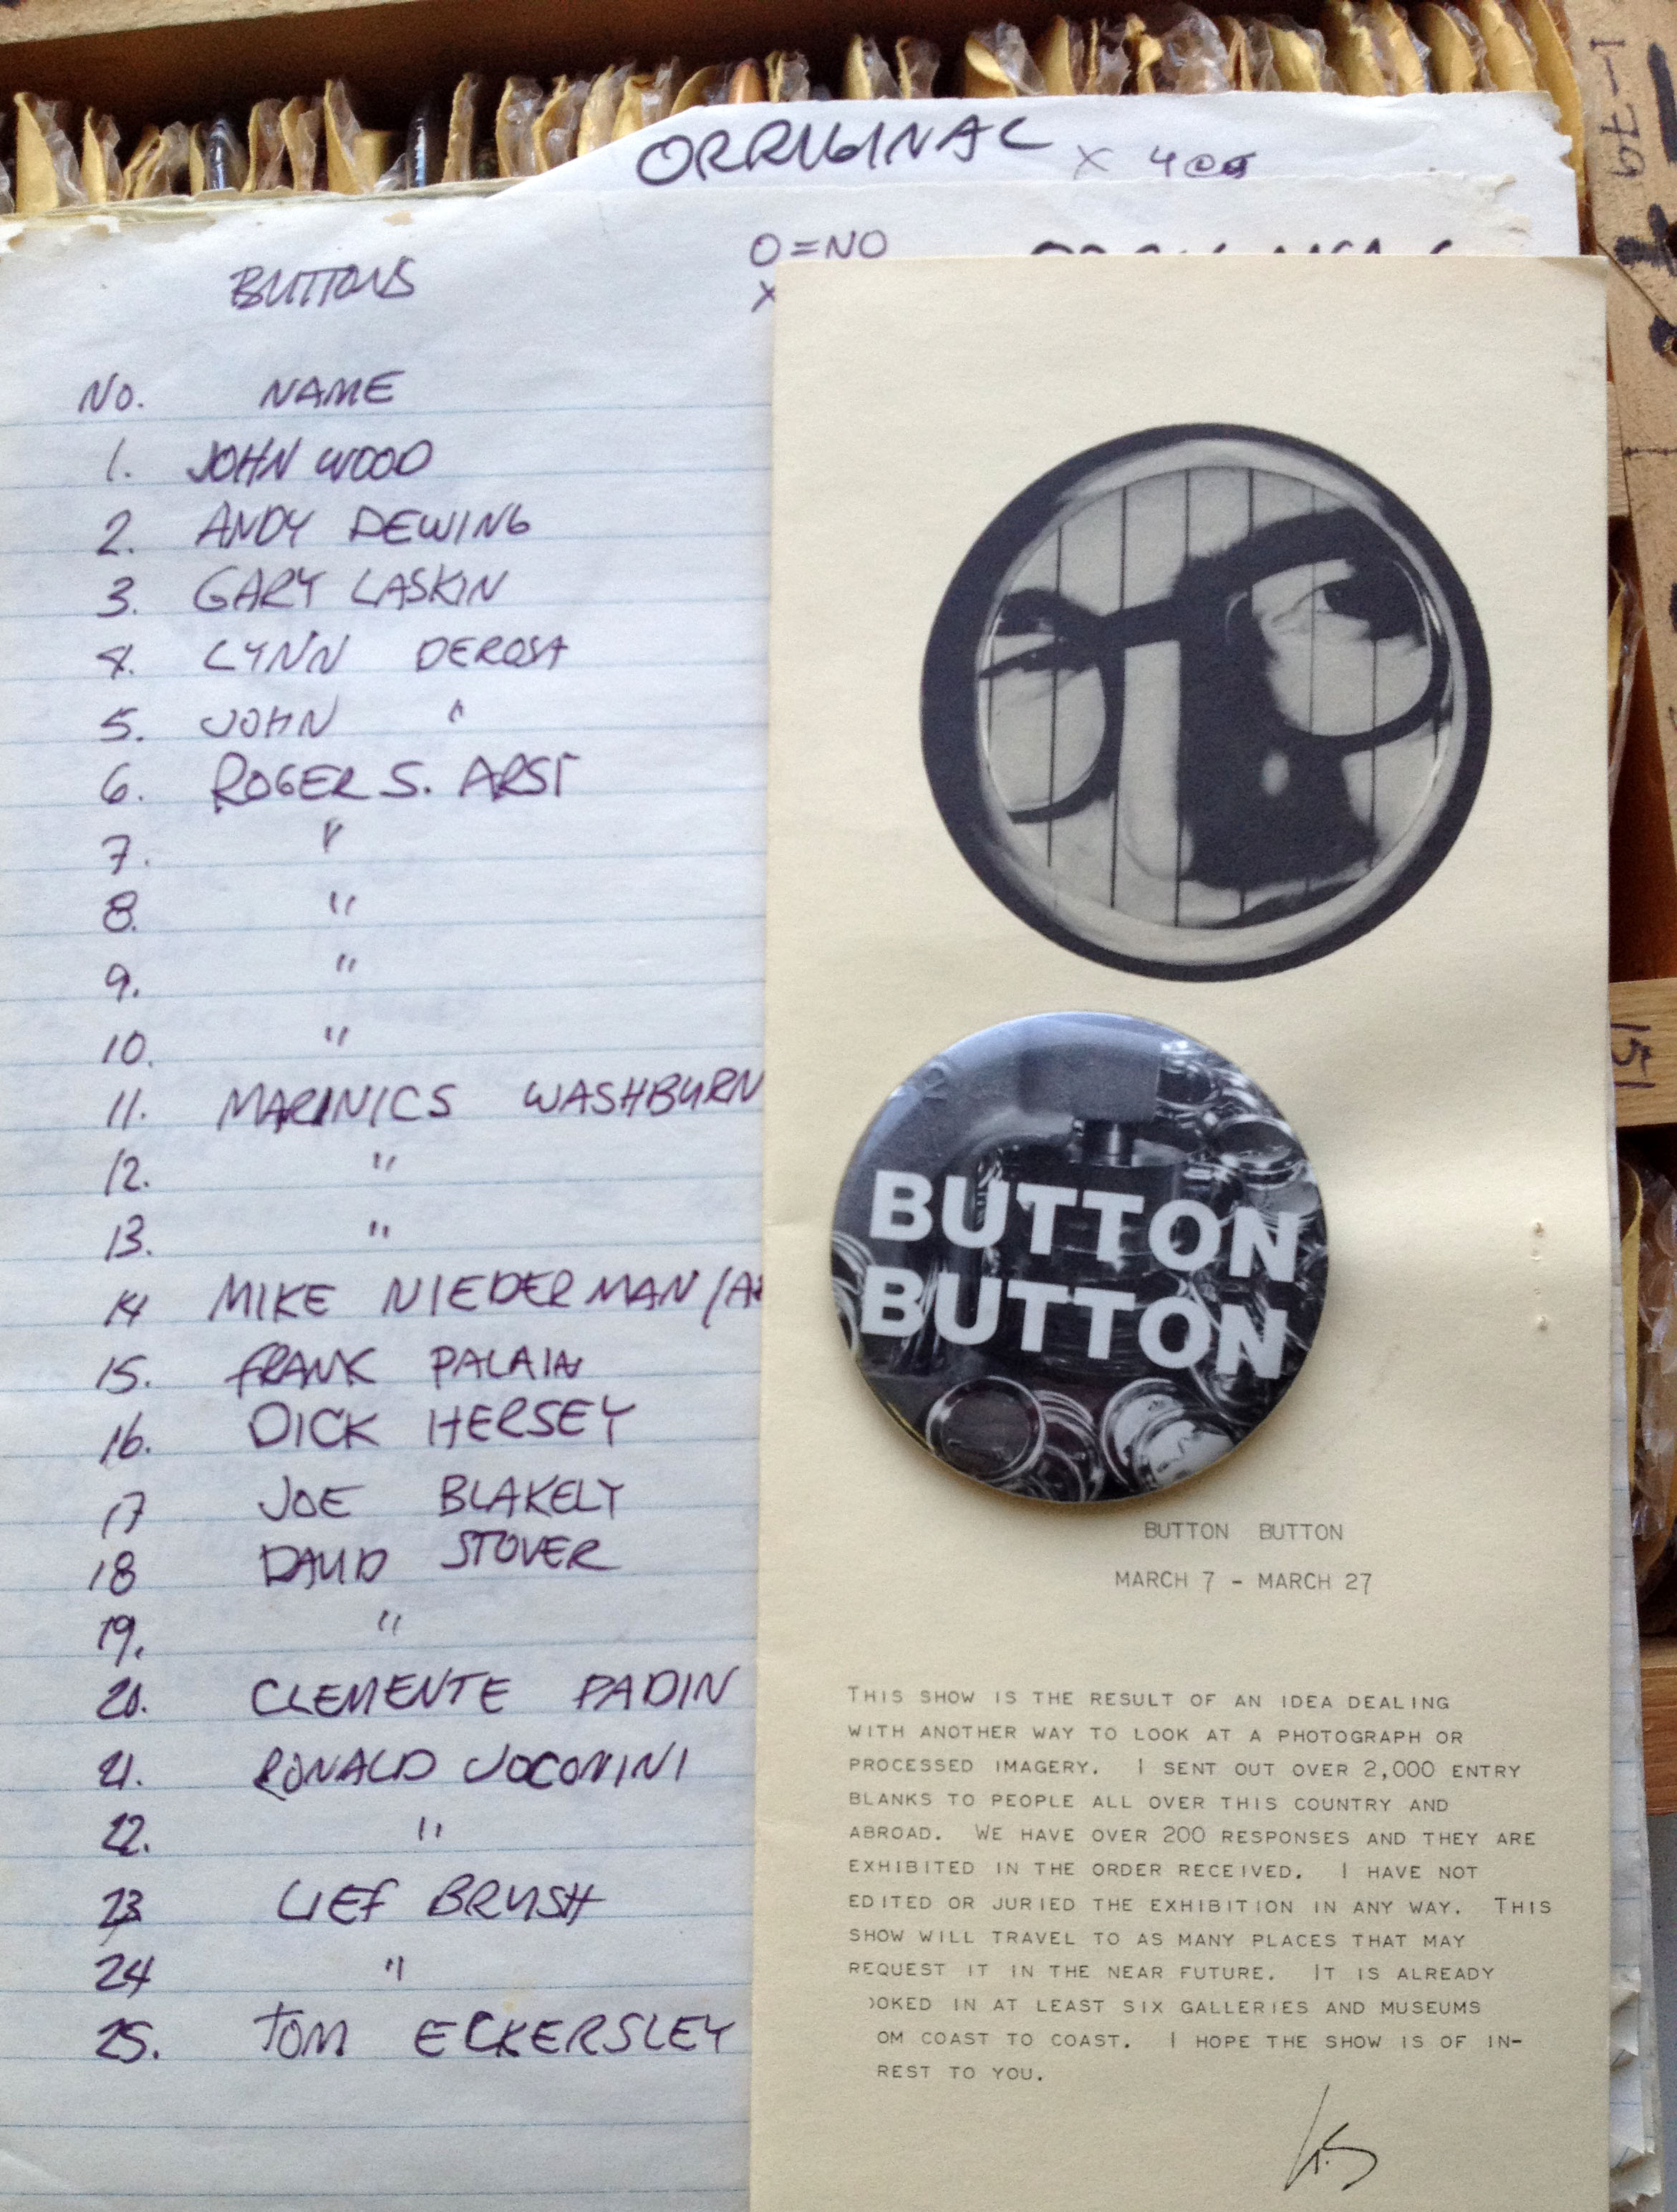 His donations to Scholes Library are “raw materials” that have been boxed, moved, stored, shifted, dropped, photographed, and finally shipped back to the relative comfort of Scholes Library in the village of Alfred, where they can be prodded and coaxed into new forms.
The display in Scholes Library will be up from February 10th through March 10th.
– John Hosford
AU Libraries Count! … Literally!
AU Libraries Count! Literally!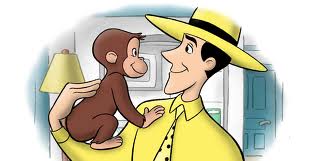
Yay libraries! Everyone values libraries. Who could not love the place that loaned you your first Curious George book? Or saved you during that hellacious all-nighter on “Nietzsche Meets James Joyce: an Anthropologic Investigation into The Quantum Mechanics of Prose”? Whether it’s following the Man in the Yellow Hat or citing Hawking’s History of Time, we have all been influenced and rescued by a “good library”. The value of a good library has rarely been challenged. For generations, the simple co-location of materials, services and expertise assured a measure of all-around “goodness.”
But things have changed. We have entered an “e-everything” world: E-Books, E-Journals, E-Collections, E-Reserves, E-Zines, E-Publishing, E-Reference, E-Scholarship, and so on. Many of our most valued resources and services are no longer bound by “place.” No longer will a high “gate-count”, or a huge number of volumes, a special collection, a quantity of on-site services, or the availability of librarian expertise truly indicate the real value of a library.
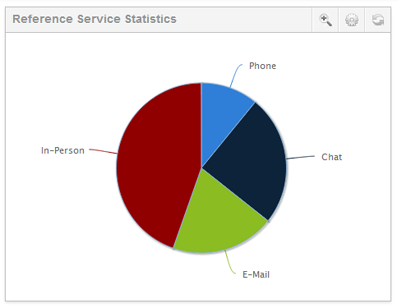
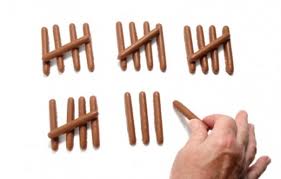
Alright then, how can libraries capture and measure their real value? Well, we do it the old fashioned way. We count! Only by collecting and studying meaningful details of your interactions with us can we best express our concrete impact to our community and plan for strategic improvement. We count a wide variety of interactions that make a difference to your success. Some of the statistics we count are obvious, but we also analyze interactions you may not even recognize as library services. As a result, the AU Libraries can assure you that you will receive better and more efficient service. We are measuring a great deal about how, why, where, and when you use the library and we are learning what ways our libraries have value and meaning to you.
Here are just a few of the things we are analyzing:
- How you use the library on campus and at a distance
- Your most frequently asked questions
- Time required to help you
- Which curriculums/assignments need most assistance
- Which services/resources you use (or don’t use)
- Time of day/week/month/year you use services
- Most common issues with our services/resources
- How service is delivered (phone, text, in library, on the street, drop in, department, etc.)
- Number of instruction sessions we teach, to whom, on what topics, etc.
- Collaborations with instructors
- Website usage, including popular research paths, visitor locations, usage patterns, and electronic library guides
- Remote loaning/borrowing and document delivery transactions (what are we borrowing/lending, to/from who, in what areas, when, etc.)
From data like this we discover where we can:
- Improve staffing patterns and locations
- Enhance or introduce new services
- Improve current services
- Discover both strengths and weaknesses in our collections
- Learn which services are under-utilized
- Uncover impediments to efficiency
- Identify courses that could benefit from customized instruction sessions
- Help you use your time most efficiently
- Better understand your assignments
- Cultivate collaborations with faculty
- Build a more meaningful instruction program
These are just a few measurements and potential outcomes. Over the course of the coming semesters we will build a substantial databank of valuable information on how you use the AU Libraries. This is certainly a painstaking process, but your librarians and library staff are excited to see what we uncover.
Yes indeed, AU Libraries Count! In More Ways Than One!
– Mark A. Smith
Welcome to the Alfred University Library News Blog!
This blog, which we’ll more fully start posting to in January, is a replacement for the previously separate Herrick and Scholes Library blogs. Since much of our news was relevant to both libraries, we decided to consolidate!
While we’ll certainly be using this blog to keep you up to date on official library news, it will also be much more than that. We’ll be covering everything from our collections and services to theme posts dealing with university events, interviews with students and faculty, and, of course, news about upcoming library events or policy changes. This eclectic mix will be made even more varied by our range of contributors, librarians and staff members from both the Scholes and Herrick Libraries. Though many of our posts will be relevant to both libraries, some will give you the opportunity to explore a facet of one of the libraries more in-depth.
We welcome your feedback and questions in the comments section, and, while we’re at it, any suggestions for future blog posts! Feel free to leave us a note about anything you think we should write about in the future.
More coming soon!