AU Libraries Count! Literally!
Yay libraries! Everyone values libraries. Who could not love the place that loaned you your first Curious George book? Or saved you during that hellacious all-nighter on “Nietzsche Meets James Joyce: an Anthropologic Investigation into The Quantum Mechanics of Prose”? Whether it’s following the Man in the Yellow Hat or citing Hawking’s History of Time, we have all been influenced and rescued by a “good library”. The value of a good library has rarely been challenged. For generations, the simple co-location of materials, services and expertise assured a measure of all-around “goodness.”
But things have changed. We have entered an “e-everything” world: E-Books, E-Journals, E-Collections, E-Reserves, E-Zines, E-Publishing, E-Reference, E-Scholarship, and so on. Many of our most valued resources and services are no longer bound by “place.” No longer will a high “gate-count”, or a huge number of volumes, a special collection, a quantity of on-site services, or the availability of librarian expertise truly indicate the real value of a library.
Alright then, how can libraries capture and measure their real value? Well, we do it the old fashioned way. We count! Only by collecting and studying meaningful details of your interactions with us can we best express our concrete impact to our community and plan for strategic improvement. We count a wide variety of interactions that make a difference to your success. Some of the statistics we count are obvious, but we also analyze interactions you may not even recognize as library services. As a result, the AU Libraries can assure you that you will receive better and more efficient service. We are measuring a great deal about how, why, where, and when you use the library and we are learning what ways our libraries have value and meaning to you.
Here are just a few of the things we are analyzing:
- How you use the library on campus and at a distance
- Your most frequently asked questions
- Time required to help you
- Which curriculums/assignments need most assistance
- Which services/resources you use (or don’t use)
- Time of day/week/month/year you use services
- Most common issues with our services/resources
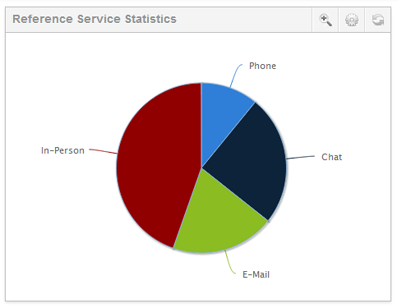
- How service is delivered (phone, text, in library, on the street, drop in, department, etc.)
- Number of instruction sessions we teach, to whom, on what topics, etc.
- Collaborations with instructors
- Website usage, including popular research paths, visitor locations, usage patterns, and electronic library guides
- Remote loaning/borrowing and document delivery transactions (what are we borrowing/lending, to/from who, in what areas, when, etc.)
From data like this we discover where we can:
- Improve staffing patterns and locations
- Enhance or introduce new services
- Improve current services
- Discover both strengths and weaknesses in our collections
- Learn which services are under-utilized
- Uncover impediments to efficiency
- Identify courses that could benefit from customized instruction sessions
- Help you use your time most efficiently
- Better understand your assignments
- Cultivate collaborations with faculty
- Build a more meaningful instruction program
These are just a few measurements and potential outcomes. Over the course of the coming semesters we will build a substantial databank of valuable information on how you use the AU Libraries. This is certainly a painstaking process, but your librarians and library staff are excited to see what we uncover.
Yes indeed, AU Libraries Count! In More Ways Than One!

– Mark A. Smith